Anyone waiting for a shift to a buyer’s market better be patient, as the continuing seller’s market shows no sign of winding down according to the most recent GF Data® report, a reliable source of data on private M&A transactions in the $10-250 million range.
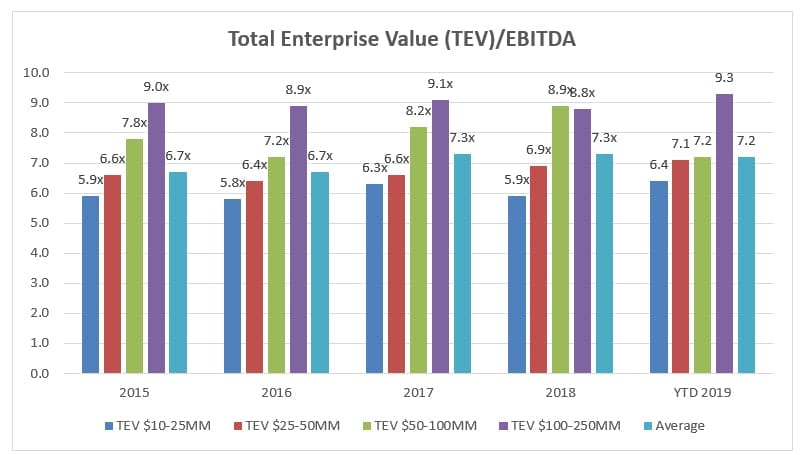
M&A Valuation Multiples by Total Enterprise Value (TEV)
The following information is based on historical information compiled by GF Data from over 200 private equity firms and other deal sponsors. According to this data, through the first half of 2019, total average valuations across all TEV categories stood at 7.2x TEV/EBITDA, virtually identical to the year-end average of 7.3x in both 2017 and 2018. Current valuations continue to be elevated compared to the 15-year historical average of 6.4x (2003-present).
When drilling down into specific TEV categories, you’ll see that the M&A market clearly favors those organizations in the largest category ($100-250 million). The average valuation for this segment is a hefty 9.3x through June, compared to the overall average (7.2x) and particularly the $10-25 million category (6.4x). Though the second largest TEV category – $50-100 million – experienced a bit of a dip in the first half of 2019 (from 8.9x at 12/31/18 to 7.2x at 6/30/19), we will chalk that up as an aberration for the time being and expect the multiple to recover to more recent levels by the end of the year.
Source: GF Data®
M&A Valuations by Industry
Four business categories (manufacturing, business services, health care services and distribution) comprise approximately 80% of GF Data deal volume. While deal multiples averaged 7.2x across all industry groups through June 30, 2019, the chart below demonstrates that technology continues to lead the pack with a 10.8x multiple. The retail industry experienced a surprise jump in valuation in the first half of the year, rising from 7.0x to 9.2x. While this represents a significant upward swing for retail, we suspect this is a short-term blip rather than a trend or sign of strength in the sector.
| TEV/EBITDA – By Industry Category | ||||||
| Industry | 2014 | 2015 | 2016 | 2017 | 2018 | 2019 YTD |
| Manufacturing | 6.1x | 6.6x | 6.1x | 6.8x | 7.0x | 6.7x |
| Business Services | 6.1x | 6.4x | 7.3x | 7.5x | 7.1x | 7.5x |
| Health Care Services | 7.2x | 7.8x | 7.6x | 8.1x | 7.8x | 7.6x |
| Retail | 6.0x | 5.5x | 7.0x | 7.6x | 7.0x | 9.2x |
| Distribution | 7.2x | 6.7x | 7.5x | 7.7x | 7.1x | 7.0x |
| Media & Telecom | NA | 6.4x | 6.6x | 8.2x | 8.6x | N/A |
| Technology | 7.7x | 8.0x | 7.4x | 10.2x | 9.6x | 10.8x |
| Other | 6.6x | 5.6x | 6.9x | 6.5x | 7.1x | 6.1x |
Source: GF Data®
What it Means for Business Owners
If you are a business owner and you’re contemplating exiting your business within the next five years, it’s important to stay current on the M&A climate and keep apprised of what other business owners in your sector are doing. Although the market may currently be ripe for an exit, we recommend owners think carefully about the timing of their exit to make sure it is right for them, their family and their business.
We also recommend that business owners speak with an M&A professional well in advance of a planned exit. At CSH, we can walk you through the exit planning process, helping you uncover opportunities to build additional value in your business and address potential issues that could result in significant transaction value erosion, or worse, a failed transaction, lost time and distraction from normal business operations. Performing sell-side due diligence helps ensure your business is presented in the best possible light, which better prepares you to negotiate the highest price possible for your business.
To discuss strategies for readying your business for sale, contact your CSH advisor or Dan Fales ([email protected]), Scott McRill ([email protected]), or Matt Gutzwiller ([email protected]) on our Transaction Advisory Services team.


